Part of the Hawksmoor Group
Part of the Hawksmoor Group

In this article we address the deteriorating national budgetary situation, which indicates that the current approach to taxation is unsustainable. In our next edition we shall look at possible solutions.
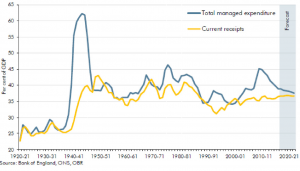
The Current Tax Burden: The Government has an annual budget deficit, with expenditure consistently exceeding receipts. As can be seen in the chart below this has been the usual state of our national finances during the last century. The chart also shows that we shall remain in deficit for the next few years and that the sum of taxes as a proportion of our economy has risen consistently since the 1990s. The Westminster rhetoric of lower income and corporate taxes has masked this trend, but our overall tax burden has risen consistently for a generation.
The era of tax cuts ended over twenty-five years ago.
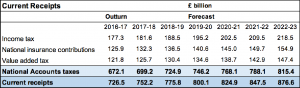
The largest contributors to our overall tax revenue are: income tax, national insurance and VAT. The Office for Budgetary Responsibility expects the receipts from these to grow over the next five years (see below). Taxes are rising both as a proportion of the economy and in total. But they need to do so.
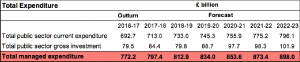
The Spending Problem: The chart on page 3 shows that spending as a proportion of the economy has been falling since 2010. This is normal during a period of recovery from a weak economy, but it does not mean that overall spending is falling. As is clear from the second table (below), government expenditure, whether it includes investment or not, is rising persistently.
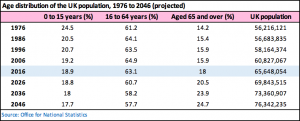
One driver of this is the age profile of the UK population. Baby Boomers (those born between the mid-40s and the late 60s) are statistically a large cohort of the population, and they have started to retire.
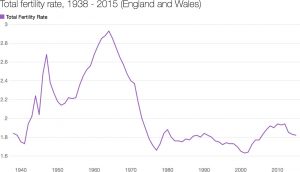
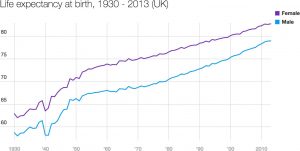
Not only were the numbers of children born in the thirty years after the Second World War higher than normal, but their life expectancy is increasing. Nowadays many retirees expect to live for twenty to thirty years in retirement. Thus the Baby Boomers’ call upon the NHS, pensions and care will also grow. When Sir William Beveridge’s report was published in 1942 male life expectancy was around 63. It had climbed to 78 in 2010 and continues to rise, but the male state pension age remains the same as in Beveridge’s day. In 2019, it will rise from 65 to 66. Only between 2026 and 2028 will it rise from 66 to 67.
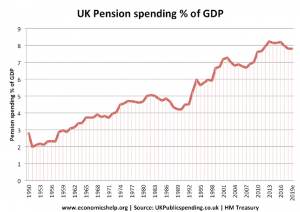
The State retirement age is slowly being increased, which will only serve to reduce the growth of pension payments, rather than stop it. Recent history shows the growing share of national income which is required to pay pensions, but it does not yet reflect the future growth of the number of pensioners, nor their expected lifespan.
This effect will also be reflected in the amount of money required for the NHS and for long term care of the elderly. It is likely that current government forecasts underestimate the future costs of these two needs. The King’s Fund and the Health Foundation, health policy think tanks, estimate that there will be a growing funding gap for the NHS over the next fifteen years. This is despite recent increases amounting to just over £20 billion by 2023-24. The chart below shows that they believe the recent increases to be inadequate, and the poll of voters, showing that 61% would pay more tax to fund the NHS properly, shows that the electorate believe them.
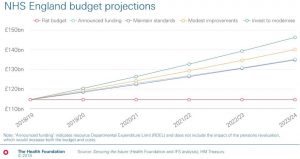
By 2033 there will be an additional 4.4 million people in the UK over 65; more people will be living with a chronic disease, and many will have multiple conditions; the cost of hospital drugs is likely to increase; and the NHS will need to pay more to recruit and re-train staff. The King’s Fund also believes that significant improvements are required, such as: catch-up increases to NHS salaries; meeting waiting time targets; improving mental health services, including for example the treatment of dementia; increasing capital spending on equipment such as MRI scanners; and investment in overall public health.
The sum of these observations is increased spending on the NHS of an average of 4% per annum for the next fifteen years, resulting in a funding deficit in 2033/34, for that year alone, of £124 billion. It’s perfectly reasonable for critics to ask whether the NHS might operate more efficiently. Quite likely it could, but successive governments have tried to improve performance, with varying levels of success. The UK’s spending per capita on health provision is not out of line with our European counterparts.
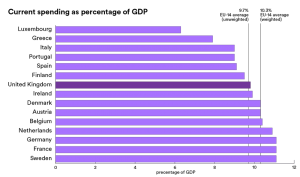
Source: OECD (https://www.oecd.org/)
Who is going to pay? As we identified at the beginning of the article, the largest sources of tax revenue for the State are income tax, national insurance and VAT. The working members of society are the main contributors to this revenue.
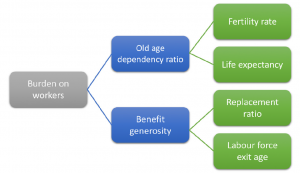
Unfortunately the proportion of non-working age relative to working age population (also known as the old age dependency ratio) is about to change considerably. Fewer workers will be supporting more retirees. It is simply not reasonable to ask younger generations to pay all the bills for the Baby Boomers, when the latter already have a disproportionate share of the national financial cake.
The possible tax consequences of this situation will be addressed in our next newsletter later this year.