Part of the Hawksmoor Group
Part of the Hawksmoor Group

Is this true? If it is then, not unreasonably, it is expected to support the notion that we are about to witness a spending boom.
But is this too complacent? What is the marginal propensity to spend after the trauma of a pandemic, which may not have gone away?
Will many people continue saving at a higher rate, even if they were able to do so anyway? What is the outlook for their income, given changes to income support and an uncertain jobs market?
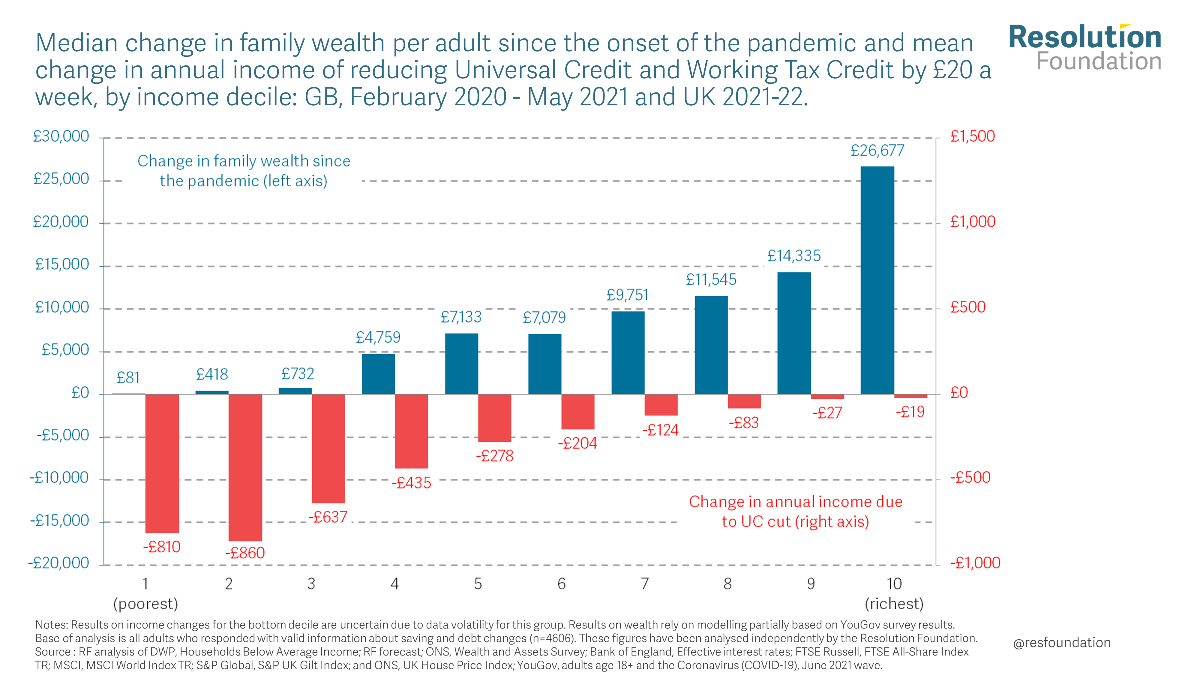
The Resolution Foundation has recently completed a new “wealth audit”[i], which shows the inequality of distribution across households in the UK.
Their research shows that it is households in the middle and at the top who have benefitted, continuing the pre-crisis trend of widening wealth gaps.
“Higher income households have been, overwhelmingly, the beneficiaries of the wealth rise – with average wealth gains of £25,000+. Poorer households meanwhile largely missed out on the wealth surge but are about to have their incomes clobbered.
“Average wealth gains across the poorest 30 per cent of the population are – at £410 – around half the average £768 income loss they’ll face. And remember we’re slightly comparing apples and pears here – that income loss is for each and every year to come.”
So, in the UK it is clearly not a given that we’re all going to go out and spend. What about in the US?
My source here is Wolf Richter’s analysis of Fed data.[i] [ii]
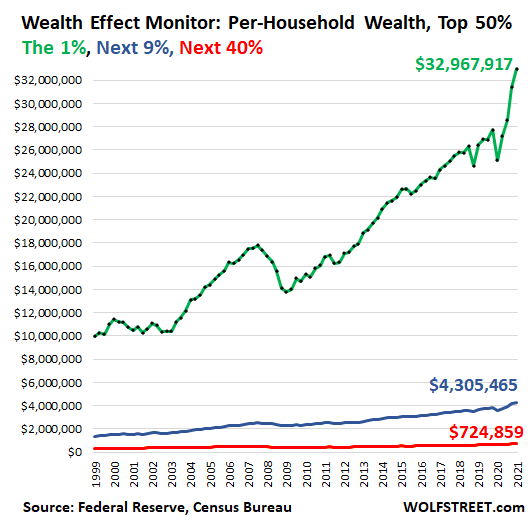
Again, we see an enormous disparity as monetary policy has boosted asset prices.
“The 1% of 126 million US households – so 1.26 million households – are the prime beneficiaries of the Fed’s actions. At the end of Q1, their combined wealth was $41.5 trillion, for an average of $32.9 million per household. Over the past 12 months, their wealth increased by $7.9 million per household.
“The “next 9%” of the wealthiest households, with an average wealth of $4.3 million, gained on $708,000 per household in 12 months. The “next 40%,” with an average wealth of $725,000 per household, gained $98,000 in wealth.”
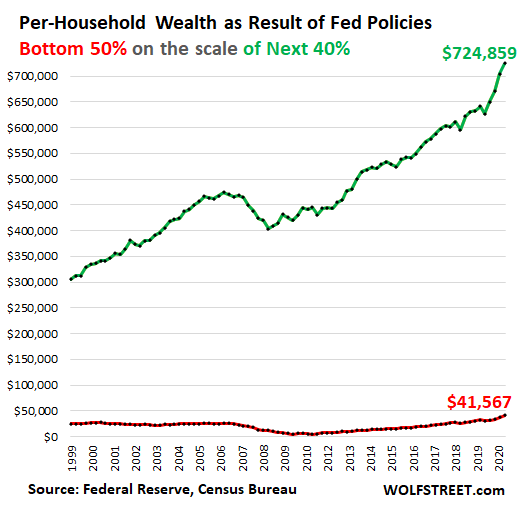
The chart below shows the wealth of the bottom 50% (red line) on the scale of “the Next 40%” (green line). This green line below is the same data as the red line in the chart above.
“The “wealth” of the bottom 50% has grown by only $14,000 in 20 years, not adjusted for inflation, of which $10,600 occurred over the past 12 months, thanks to the stimulus payments.”
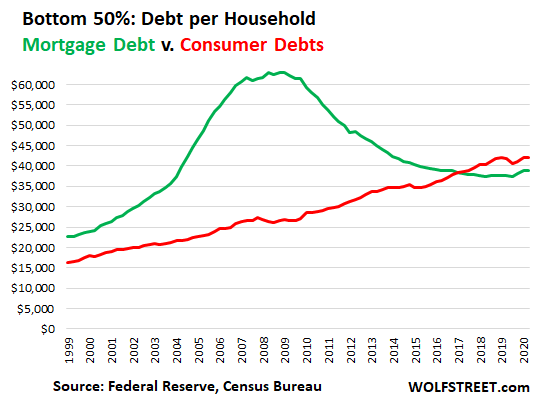
“That “wealth” of the bottom 50% is composed of $122,500 in assets minus $81,000 in debt. Mortgage debt used to be the largest portion of the debt, but consumer debt – credit card debts, auto loans, and student loans – overtook mortgage debt in 2018:”
“When the Fed’s wealth effect policies inflate the housing market, most people in the bottom 50% don’t benefit at all because they don’t own a home. But they’re paying for the Wealth Effect because their costs, including rents, are rising.”
The last round of US stimulus cheques went out to households in March and, in a gradual progression, all individual states are ending the $300 per week Covid-related increases in unemployment benefits by September.[i] All will have ended by 6th September.[ii]
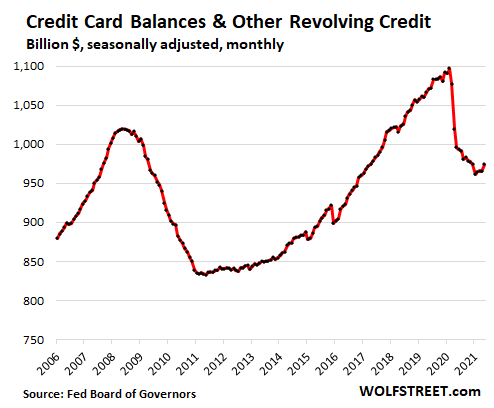
This is already having an impact upon debt levels.
Credit card debt and other revolving credit, such as personal lines of credit, ticked up by $9 billion, or by 1.0% in May from April, seasonally adjusted, according to the Fed[iii]. This was the first major increase since February 2020. This followed many months during which consumers had paid down their credit cards.
The balance is still down by nearly 11% from the peak in December 2019, and by 2.3% from a year ago.[iv]
It is clear that richer and middle-income households, which have maintained employment, are likely to have saved, and to have paid down debt to some degree. They have also benefited from a boost to their wealth.
Nevertheless, poorer households have been more susceptible to job losses, remain in a more precarious job situation, are about to lose part of their unemployment benefit and were unable to gain much wealth benefit.
The latter group are generally more disposed to spend their income gains, but any gains they had are about to disappear if they have not already done so.
Clearly, not everyone has saved or been able to see the value of their assets rise significantly, therefore, the degree of any spending boom will be dependent upon the richer and middle-income households. But to what extent will they persist with precautionary saving?
Many of these were able to maintain spending on goods throughout the last eighteen months, to the degree that they were not inhibited by health concerns and financial uncertainty, so their “pent-up” demand is likely to be predominantly for services, such as expensive holidays. To the extent that these are overseas, fulfillment may be frustrated.
Might some expectations of the degree of a spending boom be at risk of disappointment?
[i] https://www.resolutionfoundation.org/publications/wealth-gap-year/?mc_cid=4c378342cd&mc_eid=34ed4157fb
[ii] https://wolfstreet.com/2021/06/21/most-important-measure-of-the-feds-economy-my-per-household-wealth-effect-monitor-for-q1-based-on-fed-data/#comments
[iii] https://wolfstreet.com/2021/07/08/with-stimmies-fading-consumers-dip-into-credit-cards-for-first-time-since-2019-but-only-a-little-everyones-relieved/
[iv] https://www.usa.gov/unemployment
[v] https://www.cnbc.com/2021/07/20/millions-may-face-lower-unemployment-benefits-or-lose-them-altogether.html
[vi] https://www.federalreserve.gov/releases/G19/current/
[vii] https://wolfstreet.com/2021/07/08/with-stimmies-fading-consumers-dip-into-credit-cards-for-first-time-since-2019-but-only-a-little-everyones-relieved/